Are you also wondering about the bitcoin average return per year might be? The average annual return of Bitcoin over the past 15 years is approximately 93.8%.
This means that an investment of $100 in Bitcoin in 2009 would have been worth over $13,000 by the end of 2023. Bitcoin is the best performing asset in human history and it’s exciting to learn about it’s future potential.
Índice
Bitcoin Total Return (10 Year, 5 Year, 3 Years, 1 Year)
While Bitcoin isn’t exempt from the volatility during the short term, it’s delivered some impressive returns over the years. Here’s a look at Bitcoin’s annual returns from 2010 to 2022:
| Bitcoin 10-Year Return Chart | |
| Año | Return (%) |
| 2011 | 1,473 |
| 2012 | 186 |
| 2013 | 5,507 |
| 2014 | -58 |
| 2015 | 35 |
| 2016 | 125 |
| 2017 | 1,331 |
| 2018 | -73 |
| 2019 | 95 |
| 2020 | 301 |
| 2021 | 90 |
| 2022 | -81.02 |
| 2023 |
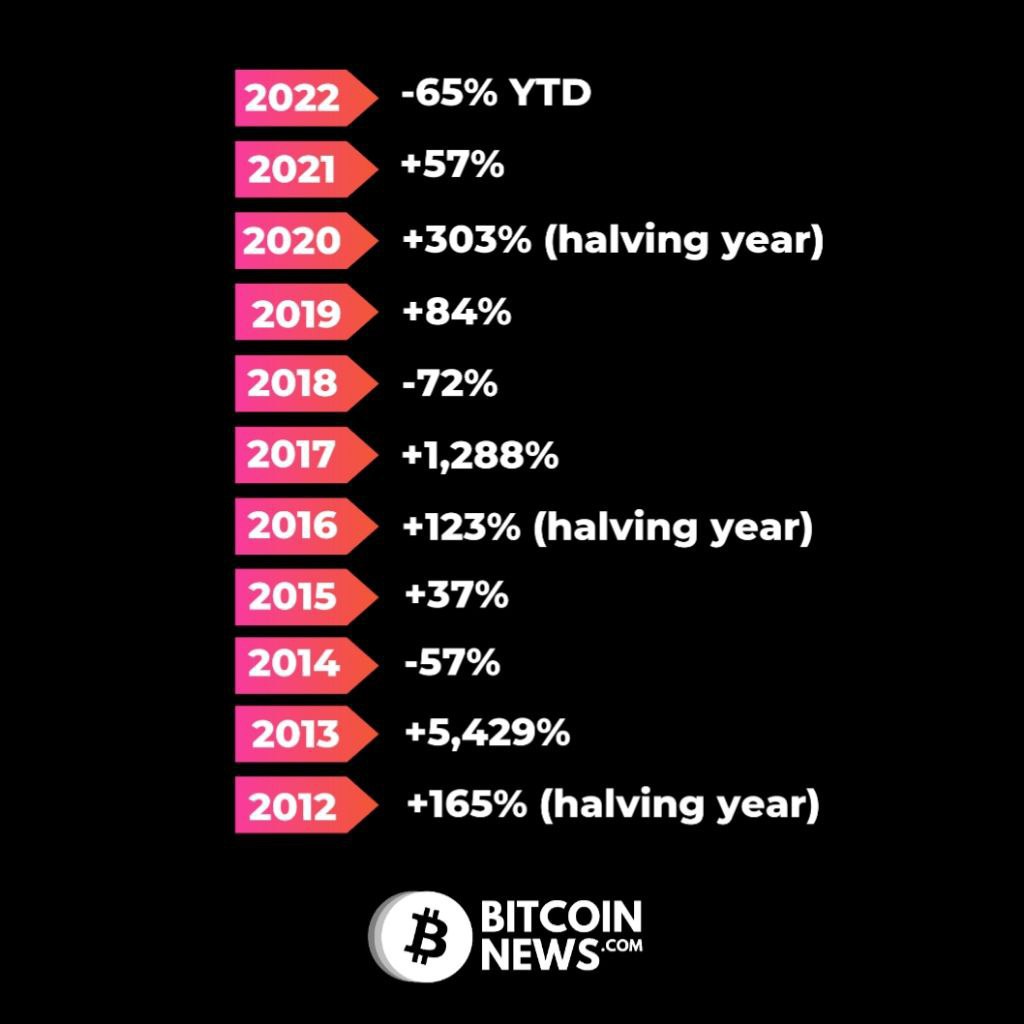
Let’s use a graphic to illustrate and compare the positive and negative annual return in Bitcoin’s price history:

The chart above shows bitcoin’s annual return year to date for each year starting from 2012.
And here’s a look at monthly returns, if you want to take a deeper dive:
| Bitcoin Monthly Returns | ||||||||||||
| Año | Jan. | Feb. | Mar. | April | May | June | July | Aug. | Sept. | Oct. | Nov. | Dec. |
| 2010 | N/A | N/A | N/A | N/A | N/A | N/A | N/A | N/A | N/A | 210.99% | N/A | 44.09% |
| 2011 | 73.33% | 65.38% | -8.77% | 346.09% | 149.71% | 84.21% | -17.08% | -38.58% | -37.32% | -36.77% | -8.62% | 58.92% |
| 2012 | 16.10% | -11.31% | N/A | N/A | 4.65% | 29.15% | 39.76% | 8.66% | 22.05% | -9.68% | 12.23% | 7.48% |
| 2013 | 51.07% | 63.55% | 178.70% | 49.66% | -7.48% | -24.31% | 8.92% | 32.76% | 0.64% | 48.82% | 470.94% | -33.15% |
| 2014 | 16.49% | -38.87% | -22.53% | 0.22% | 10.90% | 1.15% | -7.18% | -18.28% | -19.43% | -12.96% | 10.97 | -15.12% |
| 2015 | -31.34% | 16.27% | -3.90% | -3.43% | -2.52% | 14.91% | 7.42% | -19.12% | 2.82% | 31.92% | 21.44% | 13.75% |
| 2016 | -13.98% | 17.95% | -4.71% | 7.91% | 17.92% | 26.68% | -7.19% | -7.72% | 5.97% | 14.89% | 6.27% | 29.75% |
| 2017 | 0.22% | 23.18% | -9.26% | 25.28% | 70.38% | 7.70% | 16.23% | 64.23% | -7.91% | 47.94% | 54.18% | 39.25% |
| 2018 | -25.88% | 0.67% | -32.86% | 33.25% | -18.85% | -14.71% | 20.79% | -9% | -5.67% | -4.06% | -36.54% | -8.18% |
| 2019 | -7.34% | 11.04% | 7.49% | 29.70% | 60.85% | 36.41% | -6.81% | -4.84% | -13.65% | 10.48% | -17.55% | -4.64% |
| 2020 | 29.91% | -8.62% | -24.94% | 34.56% | 9.57% | -3.38% | 24.06% | 2.74% | -7.46% | 28.04% | 42.77% | 46.97% |
| 2021 | 14.37% | 36.41% | 30.11% | -1.78% | -35.38% | -6.09% | 18.63% | 13.42% | -7.02% | 39.90% | -7.22% | -18.75% |
| 2022 | -16.70% | 12.18% | 5.41% | -17.3% | -15.56% | -37.32% | 16.95% | -13.99% | -3.1% | 5.53% | -16.26% | -0.86% |
| 2023 | 39.83% | 0.02% | 23.1% | 2.73% | -6.96% | 11.97% | -4.07% | -11.29% | 3.91% | 28.52% | 8.81% | |
| 2024 |
While Bitcoin has experienced some wild monthly price swings and three years where its value has declined, you can see that its declines have been eclipsed by some incredible gains. Now let’s explore how Bitcoin’s value has changed over 10, 5, 3, and 1 years.
Bitcoin 10-Year Return
Let’s say you bought one bitcoin on August, 3rd 2013, for $1,106.75, its price at the time. If you held that one bitcoin until August 3rd, 2023, it would’ve been worth $29,310.44, and your total ROI for the 10 years would be 2,546.8%.
Bitcoin Average Return – 5-Years
We’ll also assume you purchased one Bitcoin for this example. A single bitcoin was valued at $965.31 on August, 3rd, 2018, and its value climbed to $29,310.44 by August 2023. Using our calculation above, your total ROI for those five years would be 294.1%.
Bitcoin Average Return – 3-Years
A single bitcoin was valued at $11,246.20 in August 2020, and its value climbed to $29,310.44 at the end of 2021. Your total ROI for those three years would be 160.6%.

Bitcoin Average return – 1-Year
If you purchased a single bitcoin in August 2022, you would’ve paid around $22,626.83. In one year, that value would’ve increased to $29,310.44. Your total returns for that year would be 29.54%.
Bitcoin Multi-Year Returns Compared
| Initial value | Final value | ROI (%) | |
| 15 years (2008-2023) | $0.000764 | $29,310.44 | 3,839,387,524,500% |
| 10 years (2013-2023) | $1,106.75 | $29,310.44 | 2,546.8% |
| 5 years (2018-2023) | $7,438.67 | $29,310.44 | 294.1% |
| 3 years (2020-2023) | $11,246.20 | $29,310.44 | 160.6% |
| 1 year (2022-2023) | $22,626.83 | $29,310.44 | 29.54% |
We hope you found this article helpful. Please share it with your friends and colleagues to help them learn from bitcoin price data such as average bitcoin return per year.


