The Chapwood Index reflects the true cost-of-living increase in America.
Updated and released twice a year, it reports the unadjusted actual cost and price fluctuation of the top 500 items on which Americans spend their after-tax dollars in the 50 largest cities in the nation.
Key Insights
- CPI Flaws: The Consumer Price Index (CPI) is flawed due to methodology changes and biases, no longer reflecting real cost increases accurately.
- Chapwood Index: The Chapwood Index offers an unbiased alternative, tracking prices of common items accurately, including factors like taxes and food, unlike the CPI.
- Financial Impact: Manipulated CPI may contribute to people feeling financially strained and relying more on government support, leading to the development of tools like the Chapwood Forecaster for realistic financial planning.
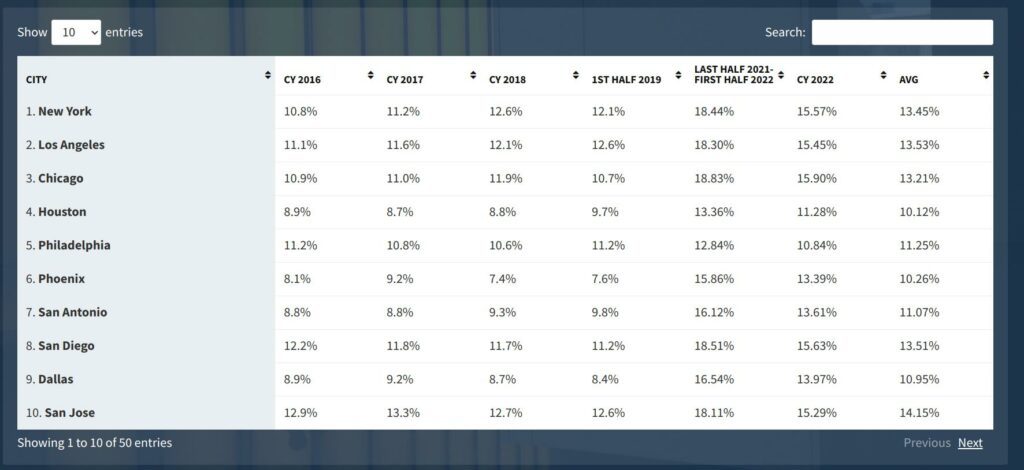
Table of Contents
How does the Chapwood index work
The Chapwood Index stands as a distinctive non-governmental metric, offering an alternative perspective on inflation that resonates with many Americans.
While the official Consumer Price Index (CPI) published by the U.S. Bureau of Labor Statistics employs a fixed basket of goods, the Chapwood Index sheds light on the real cost-of-living increases faced by average households across the nation.
Here’s how the Chapwood Index works:
- Item Selection: The creators of the Chapwood Index initially collected data on over 4,000 items that individuals typically spend money on in their daily lives. They narrowed down this list to the top 500 items that are used most frequently.
- Price Tracking: The prices of these 500 items are tracked on a quarterly basis. This tracking is done without manipulation or biases, aiming to capture the actual changes in prices over time.
- Weighted Index: The prices are used to calculate a weighted index. This means that items that are more commonly consumed or have a higher impact on daily life are given more weight in the index calculation.
- Comprehensive Coverage: Unlike the CPI, the Chapwood Index includes a wide range of items that most Americans consume in their regular lives. This includes not just basic goods, but also services, taxes, energy costs, and food expenses.
- Geographical Variations: The Chapwood Index can also be customized for specific metropolitan areas, accounting for variations in costs of living based on location.
- Comparison and Reporting: The Chapwood Index provides a clear and straightforward comparison of price changes over time. This can help individuals and researchers see how costs for everyday items are changing more accurately compared to the CPI.
The key distinction between the Chapwood Index and the CPI is that the Chapwood Index tracks a relatively smaller and more focused set of items, and it includes factors that are often excluded from the CPI calculation.
This approach aims to provide a more realistic picture of how costs are changing in people’s daily lives, helping individuals better understand their financial situations and make more informed decisions.
The government’s baseline CPI measure excludes items such as taxes, energy, and food. As we have explained it is clearly manipulated and biased, therefore it is rarely accurate
Chapwood Index Website
Items measured in the Chapwood Index 2023
From the official chapwood website we can learn:
In creating the Chapwood Index over a 2 year period we collected over 4,000 items from friends and associates around the country of items they spend money on in the daily course of their lives.
Chapwood Index
We then narrowed the list down to the top 500 items that were used most frequently. We then track and monitor the price increase of these 500 items without any manipulation and biases.
We take the precise price for the same item quarter by quarter and calculate the increase or decrease.
These items include basically everything that most Americans consume during the regular course of their lives.
List of items in the index
- BAGELS
- STARBUCKS COFFEE
- ADVIL
- CAR WASHES
- PIZZA
- TOLLS
- TAXES
- PEOPLE MAGAZINE
- GASOLINE
- FAST FOOD RESTAURANTS
- GYM MEMBERSHIPS
- HOME REPAIRS
- PIANO LESSONS
- LAUNDRY DETERGENT
- LIGHT BULBS
- UNDERWEAR
- COMPUTER PAPER
- TOOTHPASTE
- OIL CHANGES
- INTERNET SERVICE
- GYMBOREE LESSONS
- MOBILE PHONE SERVICE
- CABLE TV
- PET FOOD
- DRY CLEANING
- MOVIE TICKETS
- TOOTHPASTE
- HAIRSPRAY
- SCHOOL SUPPLIES
Chapwood Index Table
Below you find a sample table of the chapwood index reporting the inflation rate between 2016-2022 for the top 10 cities in the USA.
| CITY | CY 2016 | CY 2017 | CY 2018 | 1ST HALF 2019 | LAST HALF 2021-FIRST HALF 2022 | CY 2022 | AVG |
|---|---|---|---|---|---|---|---|
| 1. New York | 10.8% | 11.2% | 12.6% | 12.1% | 18.44% | 15.57% | 13.45% |
| 2. Los Angeles | 11.1% | 11.6% | 12.1% | 12.6% | 18.30% | 15.45% | 13.53% |
| 3. Chicago | 10.9% | 11.0% | 11.9% | 10.7% | 18.83% | 15.90% | 13.21% |
| 4. Houston | 8.9% | 8.7% | 8.8% | 9.7% | 13.36% | 11.28% | 10.12% |
| 5. Philadelphia | 11.2% | 10.8% | 10.6% | 11.2% | 12.84% | 10.84% | 11.25% |
| 6. Phoenix | 8.1% | 9.2% | 7.4% | 7.6% | 15.86% | 13.39% | 10.26% |
| 7. San Antonio | 8.8% | 8.8% | 9.3% | 9.8% | 16.12% | 13.61% | 11.07% |
| 8. San Diego | 12.2% | 11.8% | 11.7% | 11.2% | 18.51% | 15.63% | 13.51% |
| 9. Dallas | 8.9% | 9.2% | 8.7% | 8.4% | 16.54% | 13.97% | 10.95% |
| 10. San Jose | 12.9% | 13.3% | 12.7% | 12.6% | 18.11% | 15.29% | 14.15% |
Who Invented the Chapwood Index?
Created by financial advisor and wealth manager Ed Butowsky, the Chapwood Index addresses perceived shortcomings in the CPI’s representation of rising costs. Unlike the CPI, which often fails to fully capture the actual expenses experienced by consumers, the Chapwood Index takes a more tailored approach by analyzing price data for an expansive range of goods and services reflective of typical consumer spending patterns.
A More Personalized Measure of Inflation
Whereas the official CPI can sometimes underestimate the impact of price hikes on consumers due to its rigid formula, Chapwood accounts for a diverse selection of commonly purchased items and services over specific periods. With a focus on the 500 most frequently acquired goods and services in urban settings it delivers a localized, individualized measure of inflation.
Critiques and Considerations
Critics of traditional inflation measures often point out their limitations, and the Chapwood Index, while offering an alternative, is not immune to scrutiny. Because it relies on data collected by Butowsky and his team, questions may arise regarding the accuracy and representativeness of the data. Additionally, the specific items incorporated in the index might not accurately reflect the spending habits of all households.
An Insightful Alternative for Skeptics
However, for those who find the official inflation figures inadequate in reflecting their experiences, the CI presents an insightful alternative. It caters to individuals and investors who are skeptical of mainstream inflation data, offering a fresh perspective on price changes in various cities.
In Conclusion
In essence, the Chapwood Index stands as a unique alternative that unveils an alternative viewpoint on inflation, catering to those who feel underserved by traditional metrics. It seeks to reveal the genuine cost-of-living increases encountered by average American households. Although it hasn’t garnered universal acceptance, it offers valuable insights into price fluctuations that resonate with a discerning audience.