Logarithmic charts, also known as log charts or log scale charts, play a crucial role in various fields, especially in finance and data visualization.
Unlike linear charts, which represent equal intervals, logarithmic charts use a logarithmic scale to display data, providing a unique perspective that can reveal valuable insights.
In this article, we’ll delve into the intricacies of logarithmic charts and explore how they can be a powerful tool for understanding trends, patterns, and dynamic data.
Table of Contents
The basics of Logarithmic Scale
Logarithmic charts employ a logarithmic scale on one or both axes, transforming exponential changes into linear ones.
In simpler terms, each increment on the scale represents a percentage change rather than a fixed value.
This makes logarithmic charts particularly useful when dealing with data that spans multiple orders of magnitude, such as stock prices, population growth, or scientific phenomena.
Bitcoin Logarithmic Chart vs Normal Chart
You probably have seen the two different Bitcoin price charts before and perhaps where wondering why they look so different.
There are several reasons why looking at the Bitcoin price in a log chart can be useful.
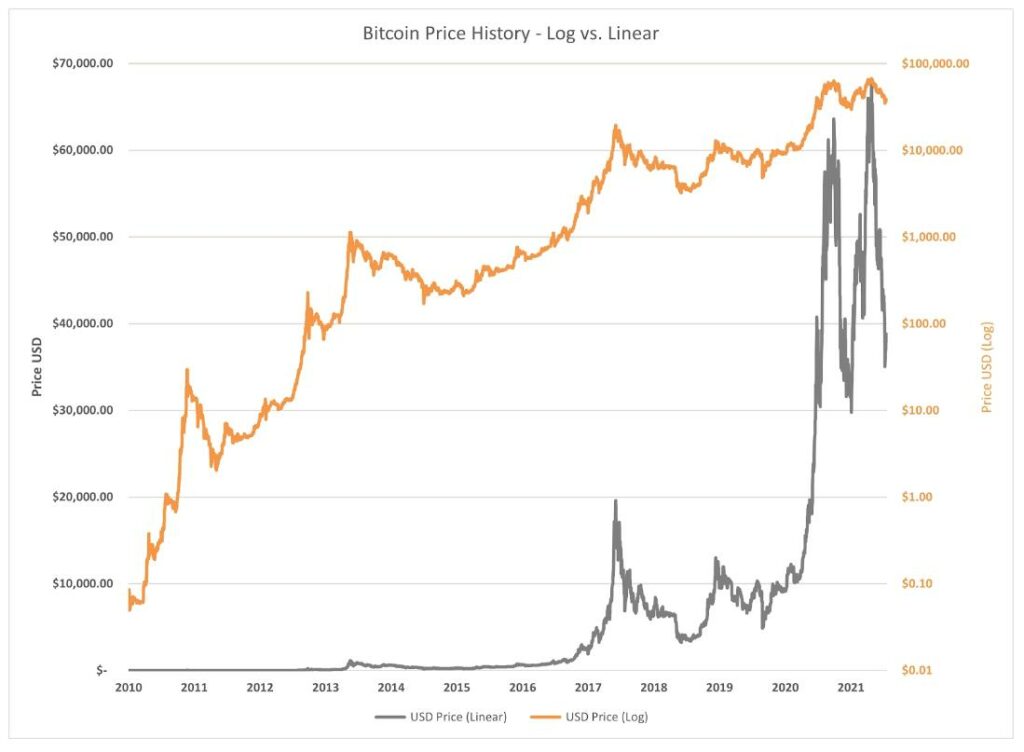
Bitcoin has historically exhibited significant periods of exponential growth, meaning its price increases at an accelerated rate.
While a linear chart can show this growth, it can compress the significant price movements that happened earlier in Bitcoin’s history, making them appear less impactful. A log chart, on the other hand, compresses the vertical axis based on multiples, allowing you to see the proportional changes in price more clearly.
This can help to understand the long-term trend. You can easily see how much Bitcoin has grown over time and identify potential support and resistance zones. It also helps to compare historical price movements. Periods of significant growth and decline are more visually comparable across different timeframes.
Log charts represent equal distances as proportional changes, not fixed amounts. This can be helpful for analyzing price movements as a percentage of the current price, rather than in absolute terms. This can be useful for:
- Evaluating volatility: You can see how volatile Bitcoin has been relative to its current price, regardless of the actual dollar value.
- Identifying potential buying and selling opportunities: Some traders use technical analysis strategies based on percentage changes, and a log chart can help them visualize these strategies more effectively.
So how does it work?
Imagine you’re comparing two things: pizza size (x) and number of slices (y). In linear regression, you’d expect a steady, constant increase in slices for every inch bigger the pizza gets. So, a 2-inch bigger pizza would have 2 more slices, a 3-inch bigger pizza would have 3 more slices, and so on.
Logarithmic regression is different. It captures situations where things grow faster at first and then slow down over time. Think of a plant growing. As a seedling, a small change in size leads to a big jump in height. But as it gets bigger, the same change in size results in a smaller increase in height.
Here’s how it works:
- Instead of a steady change in y for every change in x, the change in y is proportional to the value of x itself. Imagine the number of slices increases by a percentage based on the current pizza size, not a fixed number. So, a small pizza might get 20% more slices when it grows 2 inches, while a larger pizza might only get 10% more slices for the same growth.
- This lets logarithmic regression model things like population growth, radioactive decay, or the spread of rumors, where things start accelerating but eventually reach a limit.
Key takeaway:
- Linear regression: Steady, constant growth.
- Logarithmic regression: Faster growth at first, then slows down over time.
Logarithmic Vs Linear Scale
Linear scales: Like a regular ruler, distances represent equal amounts. This is great for seeing small, precise changes, like measuring ingredients in a recipe.
Logarithmic scales: Distances represent multiples (powers of 10, typically). Imagine a ruler where 1, 10, 100, and 1000 are equally spaced. This is useful for big changes over a large range, like comparing earthquakes (small tremors vs. massive ones) or disease outbreaks (few cases vs. widespread epidemics).
Think of it like choosing the right tool for the job. Use a regular ruler for small, precise measurements, and a special “powers of 10” ruler for seeing big changes across a wide spectrum. Both scales have their place, depending on what you want to highlight in your data.
Log Scale Applications in Finance
One of the primary domains where logarithmic charts shine is in financial analysis.
Stock prices often experience significant percentage changes over time, and a logarithmic scale can effectively capture these variations.
By using logarithmic charts, traders and investors can better identify trends, assess volatility, and make informed decisions.
The logarithmic scale also helps in comparing the relative performance of different assets, smoothing out extreme fluctuations and providing a clearer picture of long-term trends.
Visualizing Growth and Decay
Logarithmic charts are not limited to financial markets; they are equally valuable in illustrating growth and decay in various contexts. For instance, epidemiologists may use log charts to depict the spread of infectious diseases, emphasizing the rate of increase or decrease rather than absolute numbers. This can aid in predicting and managing outbreaks more effectively. Similarly, scientists studying exponential processes, such as population growth or radioactive decay, can benefit from the clarity provided by logarithmic charts.
Spotting Trends and Patterns
Logarithmic charts are adept at revealing trends and patterns that might be less apparent on linear scales. They excel in highlighting the early stages of exponential growth or decay, which can be crucial for forecasting future developments. Traders often use logarithmic charts to identify potential trend reversals or breakouts, enhancing their ability to make timely and informed decisions in dynamic markets.
Conclusion
In conclusion, logarithmic charts are a valuable tool for visualizing data that spans wide ranges of values. Whether used in finance, science, or public health, these charts provide a unique perspective that can uncover trends, patterns, and insights that might be overlooked on linear scales. By understanding the basics and applications of logarithmic charts, individuals and professionals alike can harness their power to make more informed decisions in a wide array of fields.