What are the best stocks for dollar cost averaging? In this article we share what investors need to know to decide wisely.
In the realm of investing, where fortunes can change like the wind, there’s a strategy that whispers consistency in the face of chaos.
This strategy involves investing in one of the best stocks is called dollar cost averaging. It is important for investors to look into one of the best stocks for dollar cost averaging if not all, and try this consistent, long term game.
Inhaltsübersicht
How Dollar Cost Avering (DCA) Stocks Work
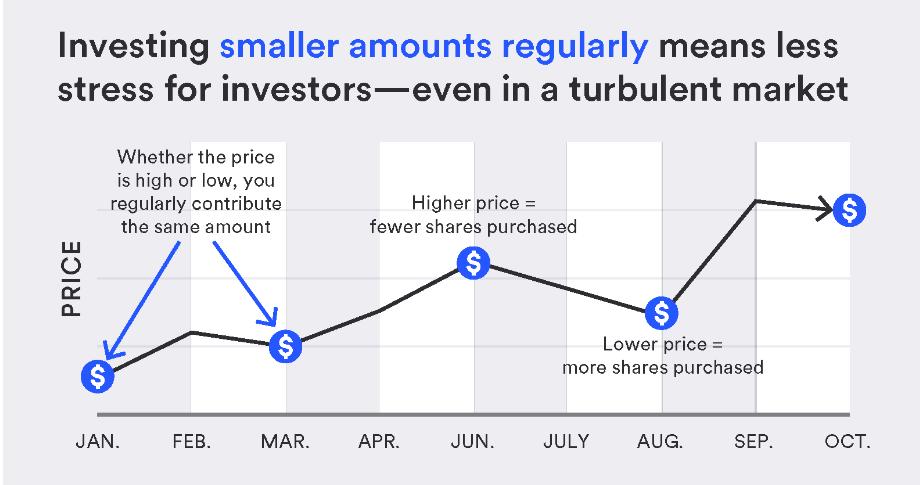
Consider an investor who intends to put $500 into a specific stock every month. When prices are low, the investor receives more shares for the same money, and when prices are high, the investor receives fewer shares. This steady investment method where one constantly invests in the best stocks eventually balances out the ups and downs, resulting in a more stable and potentially profitable portfolio.
That’s Dollar Cost Averaging, a method of investing a set amount of money at regular periods regardless of market conditions. By doing so, you effectively level out the impact of market volatility by purchasing more shares when prices are low and less shares when prices are high.

Is Dollar Cost Averaging Worth It?
Dollar cost averaging (DCA) is a strategy that divides an investor’s available capital into equal amounts and invests the funds at regular intervals over a predetermined period. Investors who use this strategy usually purchase more shares when prices are low and fewer shares when prices are high. The idea is that over time, the average cost of the shares purchased will be lower than the average market price.
DCA is a relatively simple and low-risk way to invest for those who can’t stomach the rapid changes of the stock market. It also allows investors with limited funds to build a diversified portfolio over the long-term. If you stick with high-quality stocks with a good track record, this strategy can be a smart way to slowly accumulate a portfolio with little risk of taking a large loss.
However, with DCA, you may not take full advantage of rising prices in the market. It is also possible that a market’s gains could be so expansive that an investor would have been better off purchasing all their shares at once. In addition, investors may end up paying fees periodically if investing through a broker.
Overall, dollar cost averaging can be a safe and useful approach for conservative investors who don’t want to take risks in the stock market. But it would behoove you to do some further research on this strategy before committing to using it. Consider the advantages and disadvantages of this investing technique to help you determine if it is the right approach for you.
Benefits of Investing in One of the Best Stocks for Dollar Cost Averaging
This approach contrasts with trying to time the market by investing a lump sum all at once. Here are some benefits of dollar-cost averaging:
- Reduced Risk of Timing the Market: One of the primary advantages of DCA is that it reduces the risk of trying to time the market. Timing the market is notoriously difficult, even for experienced investors. DCA allows you to spread your investments over time, potentially avoiding the negative consequences of making large investments right before a market downturn.
- Mitigates Volatility: Markets can be highly volatile in the short term, causing significant price fluctuations. DCA helps mitigate the impact of this volatility by purchasing assets at various price levels. This can lead to a more consistent average cost per share over time.
- Disciplined Approach: DCA enforces a disciplined approach to investing. By investing a fixed amount at regular intervals, you avoid making impulsive investment decisions based on short-term market fluctuations or emotions.
- Automated Investing: DCA can be easily automated through various investment platforms. This makes it convenient for investors to stick to their investment plan without the need for constant monitoring.
- Averaging Out Peaks and Troughs: When you invest at regular intervals, you’re buying both when prices are high and when they’re low. This helps you avoid investing a large sum right at a market peak and instead allows you to take advantage of potential buying opportunities during market downturns.
- Less Emotional Investing: Emotional investing can lead to buying high and selling low, which is counterproductive. DCA helps remove emotion from the equation, as you’re following a predetermined investment plan.
- Long-Term Focus: DCA encourages a long-term perspective on investing. Since you’re consistently investing over time, you’re more likely to stay invested through market ups and downs, which is crucial for long-term wealth accumulation.
- Simplicity: DCA is a straightforward strategy that doesn’t require in-depth knowledge of market timing or complex investment strategies. It’s suitable for both new and experienced investors.
- Lower Entry Barrier: DCA allows you to start investing with a smaller initial amount. You can gradually increase your investment as you become more comfortable.
- Potential Compounding: By consistently investing over time, you give your investments more time to potentially benefit from compounding returns, which can significantly boost your overall returns in the long run.
Top 5: Best Stocks for Dollar Cost Averaging 2023
1. Amazon (AMZN)
Consider this: an e-commerce titan soaring through the digital heavens, leaving a path of innovation in its wake. Amazon (AMZN) is the stock market’s phoenix, soaring above adversity to become the e-commerce universe’s superpower. Its current price is $133.98, with a year-to-date increase of –1.16%. The icing on the cake? Amazon does not pay dividends; instead, it usually reinvests dividends, fueling the fire of expansion and making it one of the best stocks for dollar cost averaging.
| Jahr | Revenue[154] in mil. US$ | Net income in mil. US$ | Total Assets in mil. US$ | Employees |
|---|---|---|---|---|
| 1995[155] | 0.5 | −0.3 | 1.1 | |
| 1996[155] | 16 | −6 | 8 | |
| 1997[155] | 148 | −28 | 149 | 614 |
| 1998[156] | 610 | −124 | 648 | 2,100 |
| 1999[156] | 1,639 | −720 | 2,466 | 7,600 |
| 2000[156] | 2,761 | −1,411 | 2,135 | 9,000 |
| 2001[156] | 3,122 | −567 | 1,638 | 7,800 |
| 2002[156] | 3,932 | −149 | 1,990 | 7,500 |
| 2003[157] | 5,263 | 35 | 2,162 | 7,800 |
| 2004[157] | 6,921 | 588 | 3,248 | 9,000 |
| 2005[157] | 8,490 | 359 | 3,696 | 12,000 |
| 2006[157] | 10,711 | 190 | 4,363 | 13,900 |
| 2007[157] | 14,835 | 476 | 6,485 | 17,000 |
| 2008[158] | 19,166 | 645 | 8,314 | 20,700 |
| 2009[159] | 24,509 | 902 | 13,813 | 24,300 |
| 2010[160] | 34,204 | 1,152 | 18,797 | 33,700 |
| 2011[161] | 48,077 | 631 | 25,278 | 56,200 |
| 2012[162] | 61,093 | −39 | 32,555 | 88,400 |
| 2013[163] | 74,452 | 274 | 40,159 | 117,300 |
| 2014[164] | 88,988 | −241 | 54,505 | 154,100 |
| 2015[165] | 107,006 | 596 | 64,747 | 230,800 |
| 2016[166] | 135,987 | 2,371 | 83,402 | 341,400 |
| 2017[167] | 177,866 | 3,033 | 131,310 | 566,000 |
| 2018[168] | 232,887 | 10,073 | 162,648 | 647,500 |
| 2019[169] | 280,522 | 11,588 | 225,248 | 798,000 |
| 2020[170] | 386,064 | 21,331 | 321,195 | 1,298,000 |
| 2021[1] | 469,822 | 33,364 | 420,549 | 1,608,000 |
| 2022[1] | 513,983 | −2,722 | 462,675 | 1,541,000 |
2. Apple (AAPL)
Ah, Apple (AAPL), the famous symbol of modern design and technical advancement. Apple’s stock price is currently about $174.00, representing a 13.9% year-to-date increase and a forward yield of 0.54%. It’s a stock that speaks to the future, enticing investors with its game-changing products and services. Apple does pay dividends quarterly of $0.24 per share, giving investors a taste of the company’s sweet fortune and making it one of the top stocks to dollar cost average as an investor. and makes it one of the best stocks for dollar cost averaging.
Apple, Inc. (AAPL) Yearly Returns
Jahr | Beginning Price | Ending Price | Gain or Loss | Percent Gain or Loss |
| 1981 | 34.125 | 22.125 | -12.00 | -35.16% |
| 1982 | 22.125 | 29.875 | 7.75 | 35.03% |
| 1983 | 29.875 | 24.375 | -5.50 | -18.41% |
| 1984 | 24.375 | 29.125 | 4.75 | 19.49% |
| 1985 | 29.125 | 22.00 | -7.125 | -24.46% |
| 1986 | 22.00 | 40.50 | 18.50 | 84.09% |
| 1987 | 40.50 | 84.00* | 43.50 | 107.41% |
| 1988 | 42.00 | 40.25 | -1.75 | -4.17% |
| 1989 | 40.25 | 35.25 | -5.00 | -12.42% |
| 1990 | 35.25 | 43.00 | 7.75 | 21.99% |
| 1991 | 43.00 | 56.375 | 13.375 | 31.10% |
| 1992 | 56.375 | 59.75 | 3.375 | 5.99% |
| 1993 | 59.75 | 29.25 | -30.50 | -51.05% |
| 1994 | 29.25 | 39.00 | 9.75 | 33.33% |
| 1995 | 39.00 | 31.875 | -7.125 | -18.27% |
| 1996 | 31.875 | 20.875 | -11.00 | -34.51% |
| 1997 | 20.875 | 13.125 | -7.75 | -37.13% |
| 1998 | 13.125 | 40.9375 | 27.8125 | 211.90% |
| 1999 | 40.9375 | 102.8125 | 61.875 | 151.15% |
| 2000 | 102.8125 | 29.75* | -73.0625 | -71.06% |
| 2001 | 14.875 | 21.90 | 7.025 | 47.23% |
| 2002 | 21.90 | 14.33 | -7.57 | -34.57% |
| 2003 | 14.33 | 21.37 | 7.04 | 49.13% |
| 2004 | 21.37 | 64.40 | 43.03 | 201.36% |
| 2005 | 64.40 | 143.78* | 79.38 | 123.26% |
| 2006 | 71.89 | 84.84 | 12.95 | 18.01% |
| 2007 | 84.84 | 198.08 | 113.24 | 133.47% |
| 2008 | 198.08 | 85.35 | -112.73 | -56.91% |
| 2009 | 85.35 | 210.732 | 125.382 | 146.90% |
| 2010 | 210.732 | 322.56 | 111.828 | 53.07% |
| 2011 | 322.56 | 405.00 | 82.44 | 25.56% |
| 2012 | 405.00 | 532.17 | 127.17 | 31.40% |
| 2013 | 532.17 | 561.02 | 28.85 | 5.42% |
| 2014 | 561.02 | 772.66* | 211.64 | 37.72% |
| 2015 | 110.38 | 105.26 | -5.12 | -4.64% |
| 2016 | 105.26 | 115.82 | 10.56 | 10.03% |
| 2017 | 115.82 | 169.23 | 53.41 | 46.11% |
| 2018 | 169.23 | 157.74 | -11.49 | -6.79% |
| 2019 | 157.74 | 293.65 | 135.91 | 86.16% |
| 2020 | 293.65 | 530.76* | 237.11 | 80.75% |
| 2021 | 132.69 | 177.57 | 44.88 | 33.82% |
| 2022 | 177.57 | 129.93 | -47.64 | -26.83% |
3. Microsoft (MSFT)
Microsoft (MSFT) is a Goliath in the world of software titans, erecting digital empires with its technology and services. Microsoft has a year-to-date growth rate of 0.85%, with a similar forward yield at a price of $316.88, demonstrating its ongoing relevance. And, yes, fellow adventurers, Microsoft does pay dividends quarterly of $0.62 per share, which can provide a consistent stream of income. This makes it one of the best stocks for dollar cost averaging.

4. Alphabet Inc. (GOOGL)
Consider a world in which information flows like a river, and Alphabet Inc. (GOOGL) has the keys to its unlocking. This tech titan, which costs $130.46, has grown by 16.8% in the year to date. The allure is in its ability to innovate and venture into unexplored territory. It is important to remember, however, that Alphabet Inc. does not currently pay dividends and through share buyback making it one of the best stocks for dollar cost averaging.
| Jahr | Revenue (mil. USD) | Net income (mil. USD) | Total assets (mil. USD) | Employees |
|---|---|---|---|---|
| 2016[42] | 90,272 | 19,478 | 167,497 | 72,053 |
| 2017[43] | 110,855 | 12,662 | 197,295 | 80,110 |
| 2018[44] | 136,819 | 30,736 | 232,792 | 98,771 |
| 2019[45] | 161,857 | 34,343 | 275,909 | 118,899 |
| 2020[46] | 182,527 | 40,269 | 319,616 | 135,301 |
| 2021[47] | 257,637 | 76,033 | 359,268 | 156,500 |
| 2022[1] | 282,836 | 59,972 | 365,264 | 190,234 |
5. Visa Inc. (V)
Visa Inc. (V) reigns dominant in the realm of financial services, connecting the global economy with its digital bridges. Visa has grown 36.5% year to date, with a price hovering at $237.37 and a forward yield of 0.54%. It’s a stock that represents the heartbeat of trade, pulsing with opportunity. And, absolutely, Visa Inc. invites its shareholders to receive dividends issued quarterly of $0.32 per share. This makes it one of the best stocks for dollar cost averaging in the market.
Consider the Dollar Cost Averaging method as you traverse the turbulent waters of the stock market, allowing you to surf the waves of consistency even as the tides of uncertainty ebb and flow. These five stocks—Amazon, Apple, Microsoft, Alphabet Inc., and Visa Inc.—serve as innovation pillars, providing not only growth but also possible dividends to the intrepid investor.
| Jahr | Revenue in million US$ | Net income in million US$ | Employees |
|---|---|---|---|
| 2005[65] | 2,665 | 360 | |
| 2006[65] | 2,948 | 455 | |
| 2007[65] | 3,590 | −1,076 | 5,479 |
| 2008[65] | 6,263 | 804 | 5,765 |
| 2009[66] | 6,911 | 2,353 | 5,700 |
| 2010[67] | 8,065 | 2,966 | 6,800 |
| 2011[68] | 9,188 | 3,650 | 7,500 |
| 2012[69] | 10,421 | 2,144 | 8,500 |
| 2013[70] | 11,778 | 4,980 | 9,600 |
| 2014[71] | 12,702 | 5,438 | 9,500 |
| 2015[72] | 13,880 | 6,328 | 11,300 |
| 2016[73] | 15,082 | 5,991 | 11,300 |
| 2017[74] | 18,358 | 6,699 | 12,400 |
| 2018[75] | 20,609 | 10,301 | 15,000 |
| 2019[76] | 22,977 | 12,080 | 19,500 |
| 2020[76] | 21,846 | 10,866 | 20,500 |
| 2021[77] | 24,105 | 12,311 | 21,500 |
| 2022[3] | 29,310 | 14,957 | 26,500 |
Häufig gestellte Fragen - FAQ
What is Dollar-Cost Averaging (DCA)? Dollar-Cost Averaging is an investment strategy
Where you invest a fixed amount of money at regular intervals, regardless of the current market price of the stock. This approach aims to reduce the impact of market volatility and helps investors avoid trying to time the market by consistently investing in stocks.
How do I implement Dollar-Cost Averaging?
To implement DCA, choose a set amount of money you’re comfortable investing at regular intervals, such as monthly or quarterly. Then, allocate these funds across your chosen stocks consistently over time. This strategy helps smooth out the impact of market fluctuations on your overall investment.
What criteria were used to select the “Top 5 Best DCA Stocks”?
The selection of the top 5 DCA stocks is based on various factors, including historical performance, stability of the company, industry trends, and growth potential. The stocks chosen have a track record of consistent growth and are considered strong candidates for long-term investment.
Can I modify the list of stocks in my portfolio over time?
Absolutely. While the “Top 5” list provides strong candidates, your investment goals and risk tolerance may change. It’s important to regularly review and adjust your portfolio to ensure it aligns with your financial objectives.
Is Dollar-Cost Averaging foolproof against market downturns?
While DCA is designed to mitigate the impact of market volatility, it doesn’t guarantee immunity against downturns. It’s important to diversify your investments and conduct thorough research on the stocks you choose to include in your DCA-Strategie.
Can I use Dollar-Cost Averaging for short-term gains?
DCA is primarily suited for a long-term investment horizon. It’s not optimized for short-term trading or attempting to profit from short-term price fluctuations.
What if I have a lump sum to invest? Should I still use DCA?
If you have a lump sum to invest, you might consider a strategy called “Value Averaging.” This involves adjusting your investment amount based on market performance. Alternatively, you can gradually invest the lump sum using DCA over a specified period to reduce the risk of poor timing.
Should I consult a financial advisor before starting a DCA strategy?
It’s always advisable to consult a financial advisor before making any investment decisions. A financial advisor can help tailor a DCA-Strategie to your specific financial goals and provide guidance on selecting the right stocks for your portfolio.


